Applicable Product:
Peoplefluent Learning
Applicable Version:
All Versions
Summary:
The Apache Tomcat® software is an open source implementation of the Java Servlet, JavaServer Pages, Java Expression Language and Java WebSocket technologies. In this article We are going to discover some techniques to dig and troubleshoot errors on the Apache Tomcat Server.
Techniques:
start tomcat
|
1
|
C:\Java\Apache Tomcat 8.0.27\bin>startup.bat |
A new window opens and you get the following output
startup output
|
1
2
3
4
5
|
Using CATALINA_BASE: "C:\Java\Apache Tomcat 8.0.27"
Using CATALINA_HOME: "C:\Java\Apache Tomcat 8.0.27"
Using CATALINA_TMPDIR: "C:\Java\Apache Tomcat 8.0.27\temp"
Using JRE_HOME: "C:\Java\jdk1.8.0_40"
Using CLASSPATH: "C:\Java\Apache Tomcat 8.0.27\bin\bootstrap.jar;C:\Java\Apache Tomcat 8.0.27\bin\tomcat-juli.jar"
|
And in the window opened by the script you get last lines like that:
Tomcat console
|
1
2
|
INFO [main] org.apache.coyote.AbstractProtocol.start Starting ProtocolHandler ["ajp-nio-8009"]
INFO [main] org.apache.catalina.startup.Catalina.startServer startup in 2649 ms
|
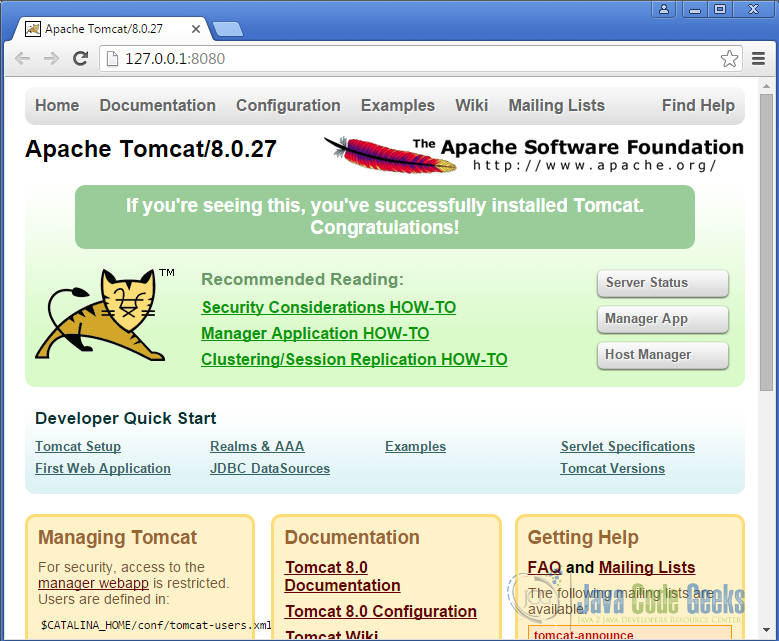
Indicating that Tomcat has started. Check that Tomcat is started opening the link
You get the following output on the browser:
The JDK provides a tool to get the PID of running Java Applications. Make sure that the JDK bin directory is on your PATH.
Type the following command in the command prompt
View the PATH variable
|
1
|
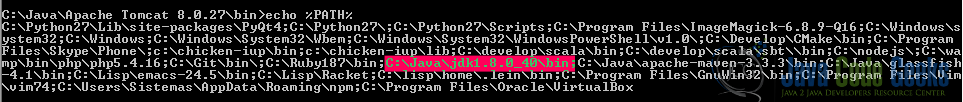
C:\Java\Apache Tomcat 8.0.27\bin>echo %PATH%
|
You get all variables in your PATH. The windows PATH is a variable that tells windows where to look for executables.
Type the following command in the command prompt
View the PATH variable
|
1
|
C:\Java\Apache Tomcat 8.0.27\bin>jps |
You should get an output similar to this:
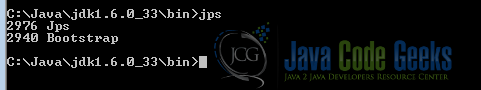
These are Java processes. The process Bootstrap is Tomcat server daemon.
Java VisualVM is a tool that provides a visual interface for viewing detailed information about Java applications while they are running on a Java Virtual Machine (JVM), and for troubleshooting and profiling these applications.
Now we are going to launch jvisualvm to start inspecting Tomcat.
Type in the command console:
jvisualvm
|
1
|
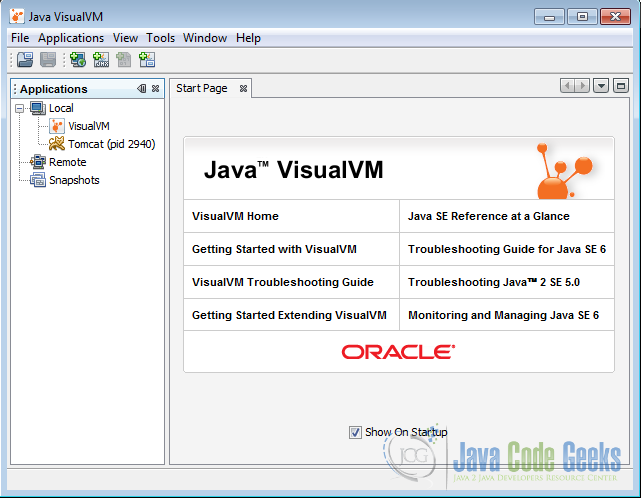
C:\Java\jdk1.6.0_33\bin>jvisualvm |
With this command you launch the following application:
Double click on the Apache Tomcat process and you get to the Process Overview screen:
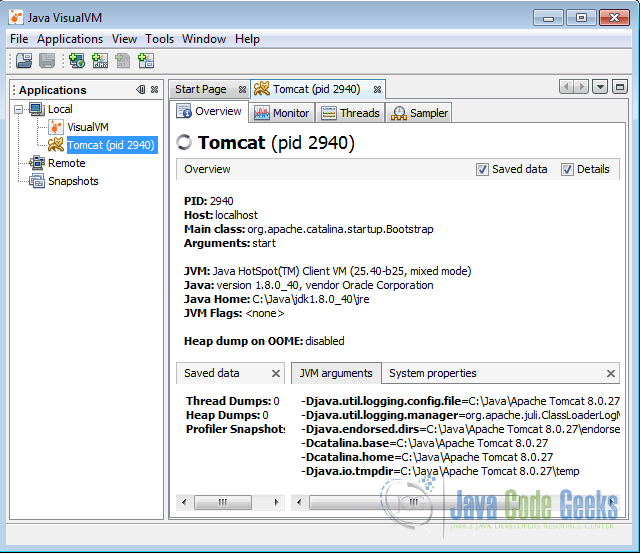
Here you can see:
The PID of Tomcat.
The host.
The main class.
The Java Home.
The JVM Flags.
The JVM Arguments used to launch Tomcat.
And a lot of useful information about the Tomcat process.
You can monitor Tomcat and view real-time, data on the memory heap, thread activity, and the classes loaded.
Click on the monitor tab.
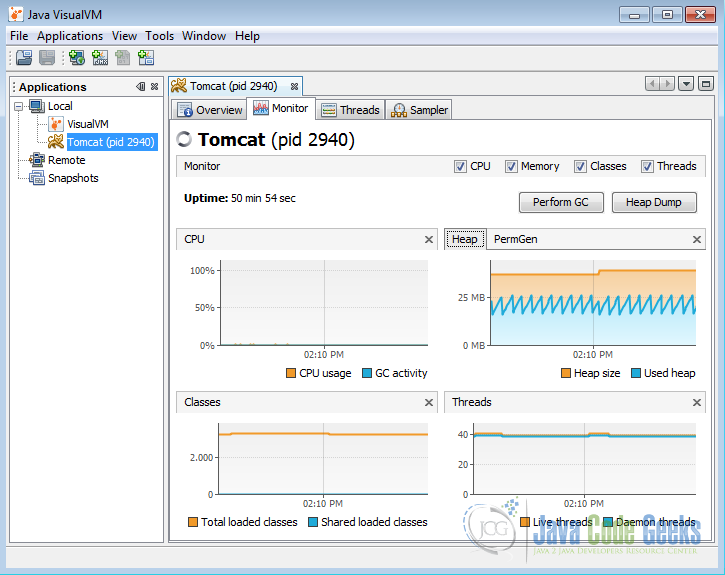
Here we can activate the garbage collector and generate head dumps.
A heap dump is a photo of the memory of a Java process. The photo contains information about the Java objects and classes in the heap at the moment the heap dump is triggered.
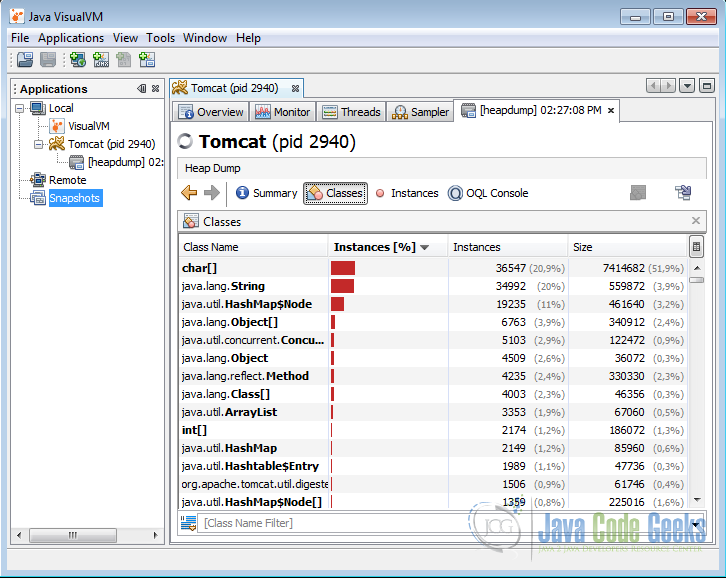
If your Tomcat server crashes with an OutOfMemoryError a heap dump useful to troubleshoot these errors.
Here you can see all threads that Tomcat is using. Also the status of each thread and the time running.
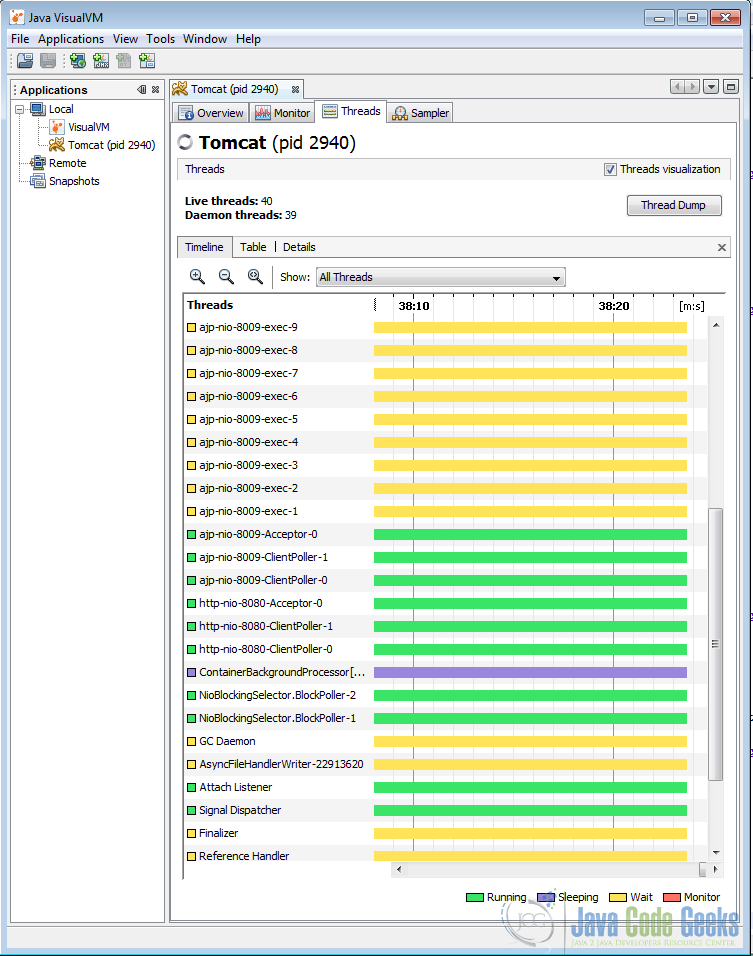
Here we can generate a Thread dump. A thread dump is a snapshot of the state of all threads that are part of the process.
Click on the button [Thread Dump] to generate a thread dump.
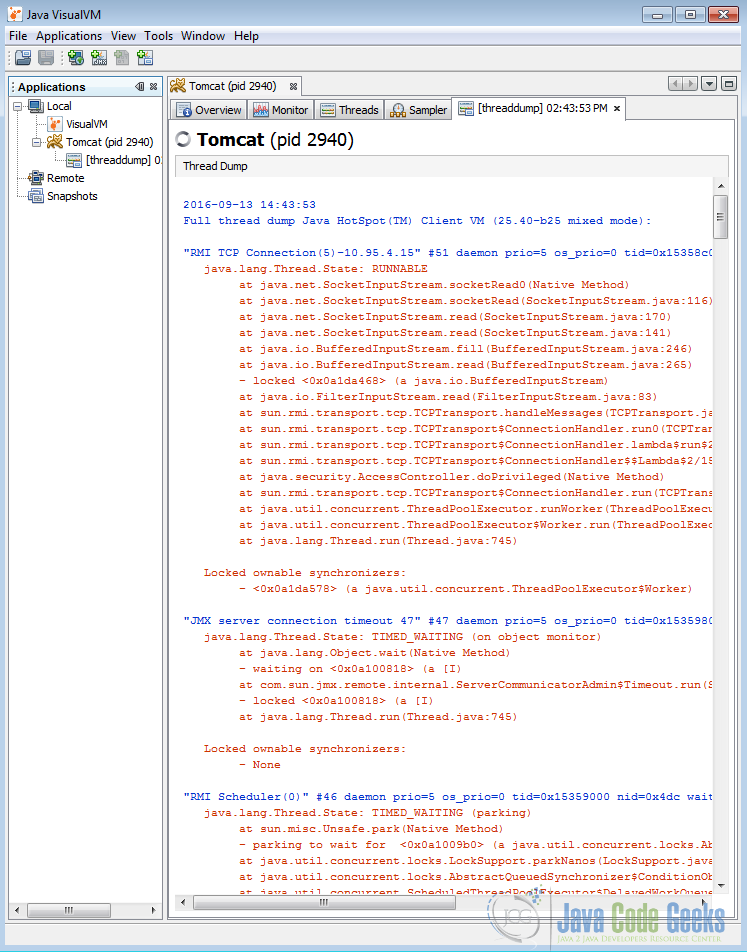
We get a lot of text.
We have to make several consecutive thread dumps of Apache Tomcat. If one or more threads in Tomcat is stuck waiting for a lock to be released you need to keep a closer look to see whats happening.
In general most troubles in Tomcat are caused by a Cbugged library and thats why we are sniffing inside thread dumps.
Inside the Tomcat install directory you can find the Tomcat log directory.
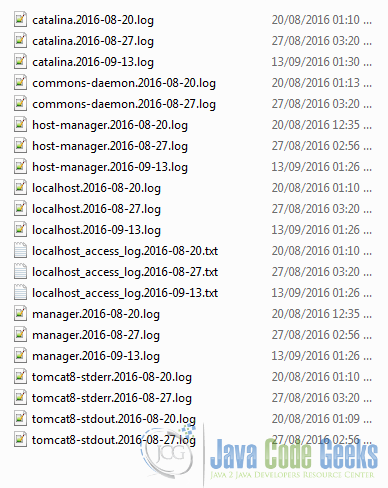
These log files can be useful to troubleshoot an error. There are multiples types of log files:
These logs are generated by date and by type. The catalina log is the global log. It is the stdout stream for the Tomcat JVM. The localhost log files is the log for a virtual host within Tomcat.
Conclusion:
There is no standard way to troubleshoot problems with Tomcat. You need to dig inside the process in the virtual machine and carefully examine the Tomcat logs to get into the root of a problem.
Most problems are caused by libraries and lack of memory. In this tutorial we provided some tools to dig inside Tomcat.
The JDK provides a lot of tools to troubleshoot these errors and to help you know how to investigate deep inside Tomcat.